- ’s price fell due to profit-taking after reaching a $124,447 peak.
- Fed rate cut speculations and Trump tensions create selling pressures on risky assets.
- Institutional demand strong; Ethereum sees inflow shift, pressuring Bitcoin ETF flows.
- Looking for actionable trade ideas to navigate the current market volatility? Subscribe here to unlock access to InvestingPro’s AI-selected stock winners.
In early August, Bitcoin hit a record high of $124,447. However, it then fell by nearly 12% because investors sold off their holdings to take profits and some leveraged positions were closed. Meanwhile, statements from at suggested the possibility of a in September, but the market had already anticipated this. As a result, Bitcoin’s brief price increases became chances for investors to sell, and its value continued to drop.
The key focus in the market is the Federal Reserve’s monetary policy. Although Powell has hinted at a possible rate cut, ongoing tension between President Trump and the Fed is reducing investors’ willingness to take risks. Trump’s push for a quick rate cut, his efforts to control the Fed’s board, and concerns over the Fed’s independence are causing worries about potential long-term harm to the US economy.
Even though Trump’s actions are aligned with market expectations for a rate cut, these circumstances are leading to selling pressure on risky assets. Meanwhile, gold has gained 4% this month, solidifying its reputation as a safe investment. Conversely, Bitcoin has dropped 5% during the same period, indicating that investor confidence remains shaky.
Institutional Demand and ETF Flows
On the side of institutional investors, demand generally remains strong. The ongoing buying trend in Bitcoin ETFs indicates that market confidence hasn’t entirely vanished. However, there is significant short-term capital moving into Ethereum and Solana. Over the past five days, Ethereum ETFs have attracted $1.83 billion, compared to just $171 million for Bitcoin ETFs. This shift represents an alternative pressure on Bitcoin.
On-chain indicators show that about 90% of Bitcoin’s current supply is still profitable. This is an important level because historically, when profitable supply drops below 90%, it often signals the beginning of correction periods. Maintaining a level above this threshold is crucial for the price to potentially return to its previous highs.
In the options market, the $116,000 level is identified as the “maximum pain” point, indicating a potential upward movement if the price stays at key support levels.
Technical Outlook for Bitcoin

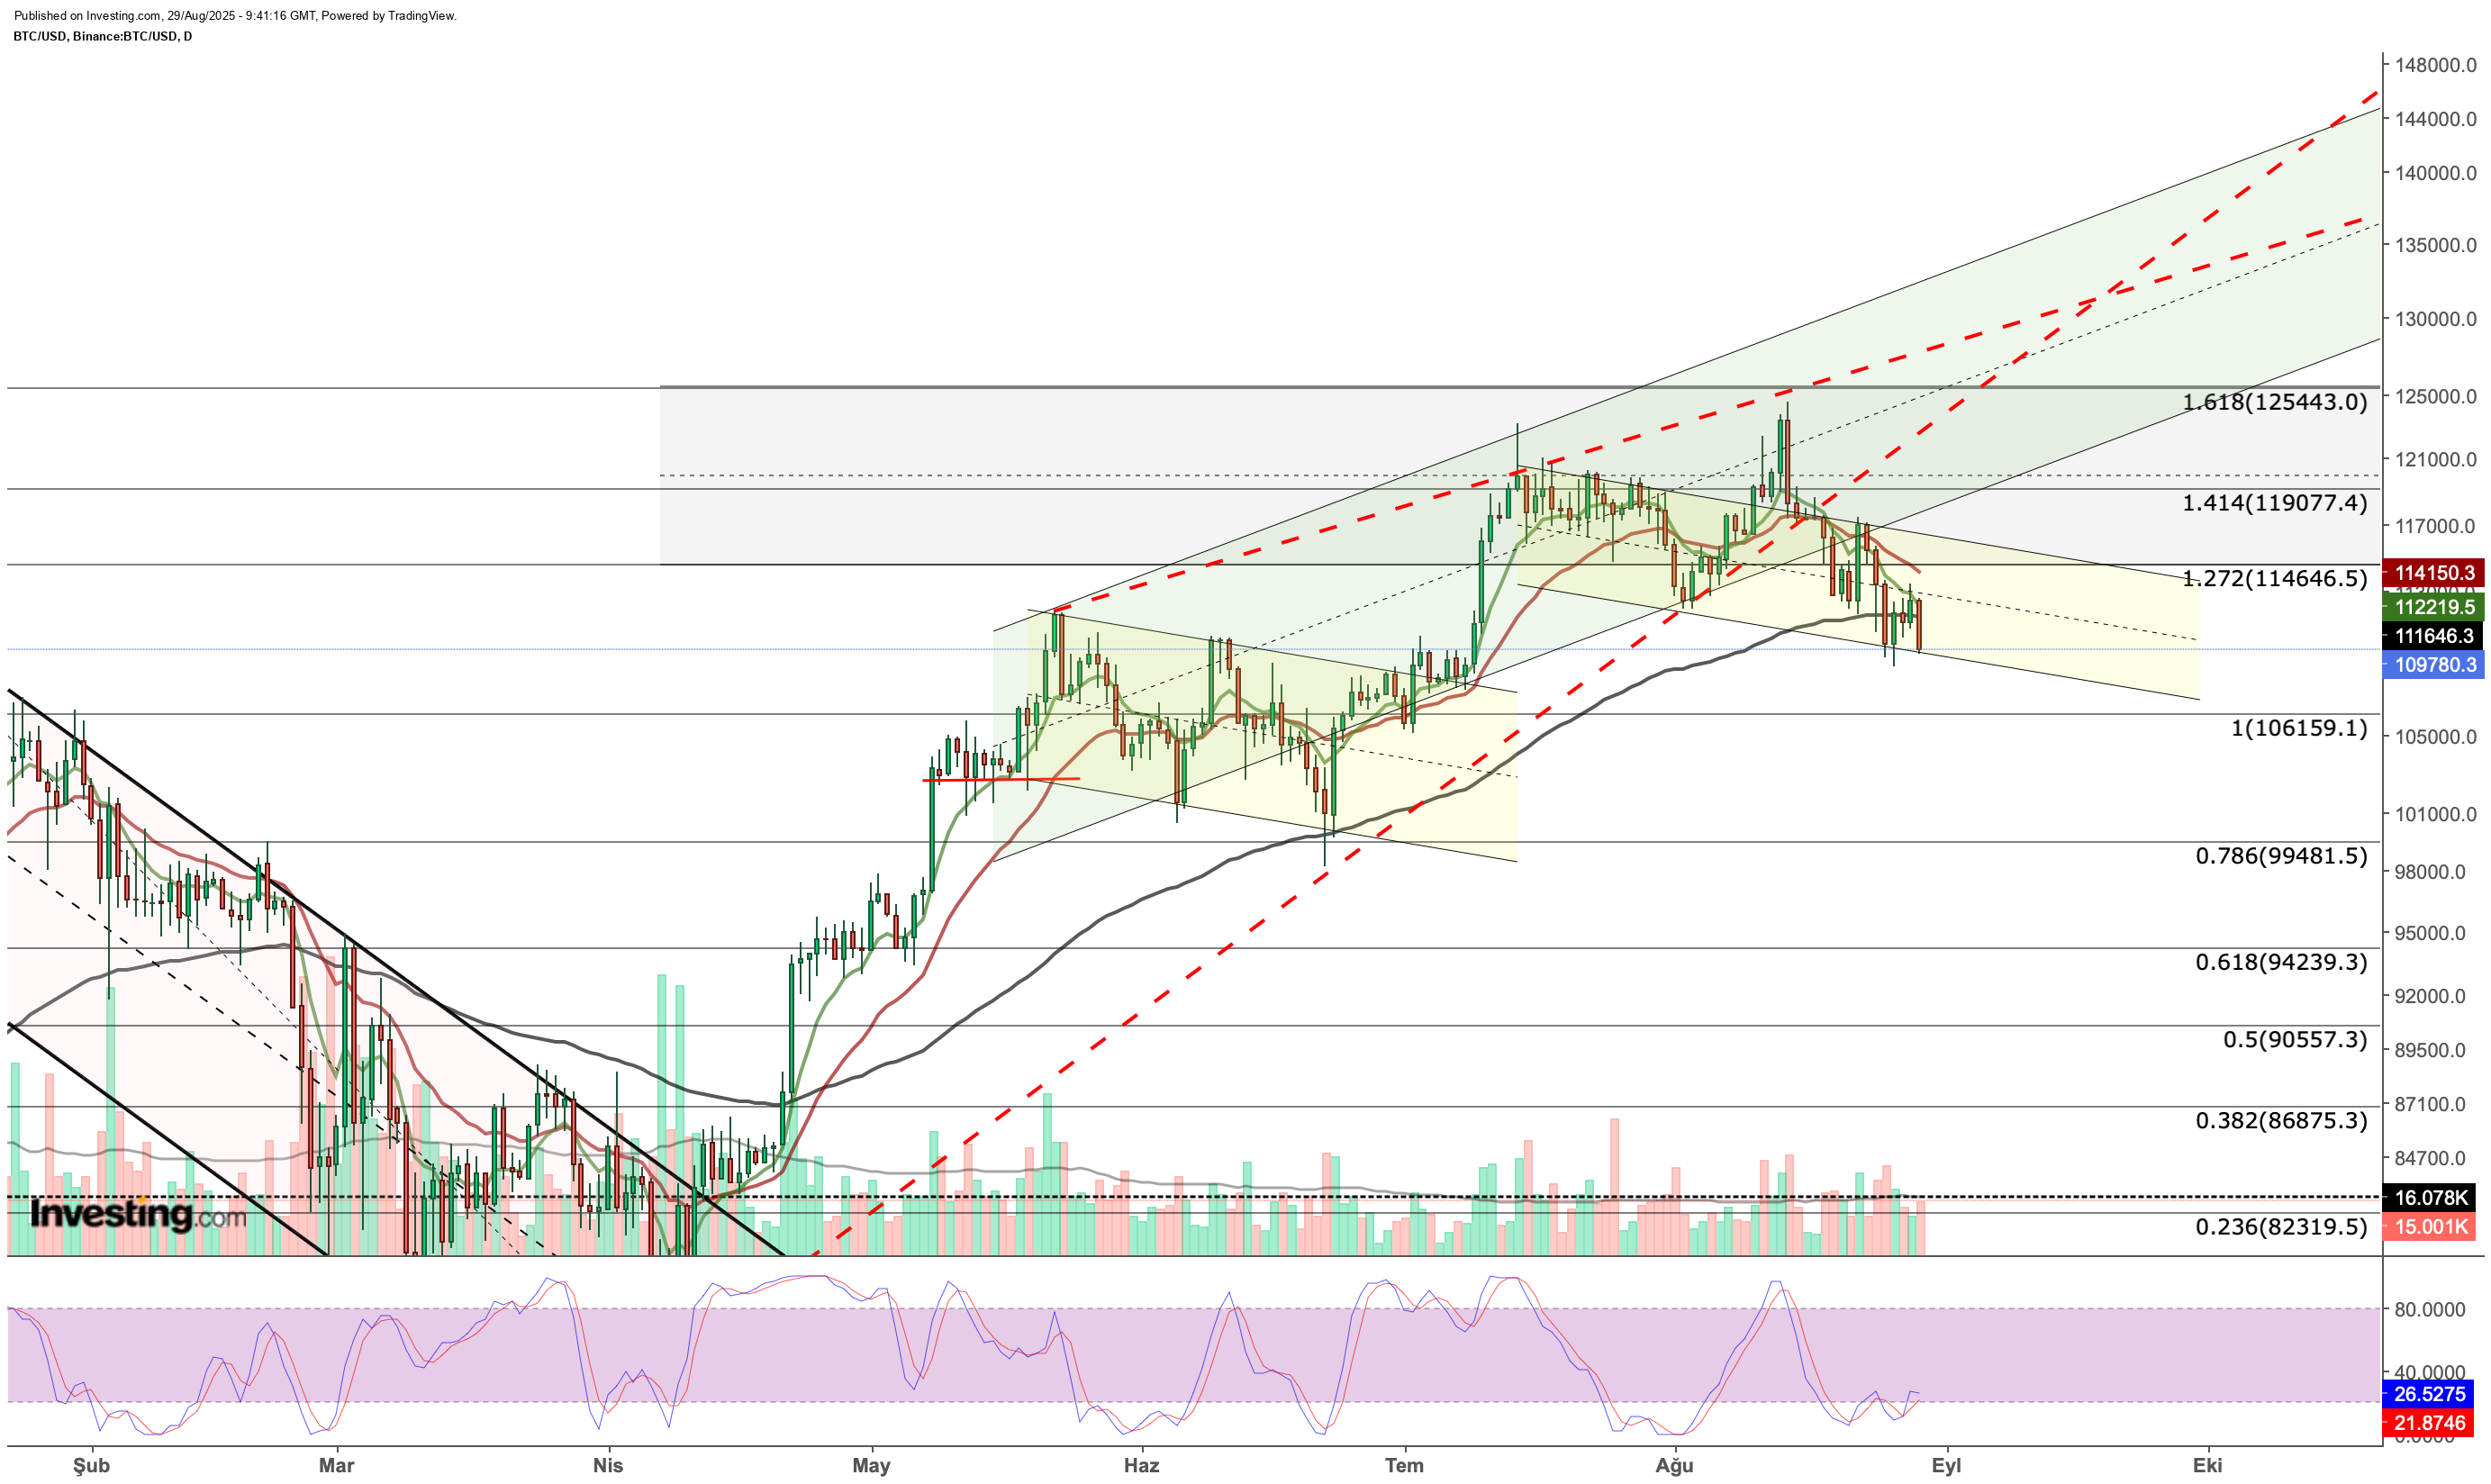
On the technical front, Bitcoin is currently testing support at $109,700 on the daily chart, nearing the lower boundary of the falling channel that has become more evident this week. If it drops below this level, Bitcoin will face $106,000, which serves as both a major support point and the lower boundary of the long-term bullish channel on the weekly chart.
Examining historical price movements, the boundary of this channel has been tested three times in the past, each time resulting in strong rallies. In an optimistic scenario, if Bitcoin declines to the $106,000 level and strong buying occurs, the price could quickly rise to the $115,000 area, which is the upper line of the falling channel on the daily chart, and then to the recent peak around $125,000.
In a broader view, a re-entry into the channel on the weekly chart could potentially signal the beginning of a new trend for Bitcoin, targeting the $150,000 area.
In a negative scenario, the $106,000 to $102,000 range will be closely watched. A break below this area with a weekly close could lead the market into a broader correction. This could bring Bitcoin down to the $93,000-$95,000 range, or even to the $70,000 region in the medium term.
Currently, Bitcoin’s short-term outlook is fragile. The market is influenced by the Federal Reserve’s interest rate decisions and tensions between Trump and the Fed on a macro level, while on-chain data and institutional demand provide structural support for the price. Thus, current declines might present buying opportunities, especially around the critical $106,000 level. Strong buying at this point could trigger a new bullish cycle in the last quarter of the year.
****
InvestingPro provides a comprehensive suite of tools designed to help investors make informed decisions in any market environment. These include:
- AI-managed stock market strategies re-evaluated monthly
- 10 years of historical financial data for thousands of global stocks
- A database of investor, billionaire, and hedge fund positions
- And many other tools that help tens of thousands of investors outperform the market every day!
Not a Pro member yet? Check out our plans here.
Disclaimer: This article is written for informational purposes only. It is not intended to encourage the purchase of assets in any way, nor does it constitute a solicitation, offer, recommendation or suggestion to invest. I would like to remind you that all assets are evaluated from multiple perspectives and are highly risky, so any investment decision and the associated risk belongs to the investor. We also do not provide any investment advisory services.
