
Gold continues to captivate investors by hitting historical records with a price of $3,434.4 per troy ounce as of April 21, a level that reflects a strong upward trend throughout the year. Starting 2025 at $2,615 per ounce, gold has surged by over 33%, driven by global economic instability, trade wars, and central bank demand.
Last year, the average price was $2,313 per ounce, but forecasts from major banks like CitiBank, which predicted an average of $2,875 for 2025, have already been surpassed by February, that may prompt analysts to revise their projections for 2025 and 2026. This rally has not only bolstered gold’s appeal as a safe-haven asset, but also sparked a revaluation of gold mining stocks.
So, let’s take a closer look and explore the gold market’s trajectory by analyzing the performance of the top five global gold mining companies, and highlighting investment opportunities in this dynamic sector.
Gold’s Meteoric Rise: A Historical Perspective
Gold’s ascent in 2025 has been remarkable, climbing from $2,600 per ounce at the year’s start to $3,434 by April 22, a 33% increase that underscores its role as a hedge against uncertainty. This growth builds on a longer-term trend, with the average price in 2024 at $2,347 per ounce, already a significant rise from earlier years.
The current price aligns with recent market sentiment- gold breaking past $3,400 per ounce amid US-China trade tensions and global instability. Forecasts from major banks further support this bullish outlook. CitiBank’s initial 2025 average price prediction of $2,875 was exceeded in February, and there are some pretty solid reasons to believe, that analysts are now revising estimates upward.
For instance, Goldman Sachs projects gold reaching $3,300 by the end of 2025, while UBS anticipates $3,500 in 2025 and Bank of America forecasts $3,400, with some analysts predicting $3,700 by year-end, according to recent web analyses. Looking to 2026, Deutsche Bank has raised its forecast to $3,700 per ounce, reflecting sustained demand from central banks and geopolitical risks.
This rally is fueled by several factors. The US-China trade war, marked by tariffs and economic uncertainty, has driven investors to safe-haven assets like gold or silver. Central banks, particularly in emerging economies, are increasing their gold reserves to hedge against currency volatility, a trend that has supported prices near record levels.
Additionally, the Federal Reserve’s upcoming rate decision on May 7, 2025, could further bolster gold. If the Fed lowers rates faster than inflation cools—potentially in response to trade war pressures signaled by the Trump administration—gold could see additional support, as lower rates reduce the opportunity cost of holding non-yielding assets like gold.
Top Gold Mining Companies: Production and Cost Analysis
The gold price surge has naturally spotlighted gold mining companies, which benefit directly from higher prices. Let’s examine the top five global gold producers in 2024 and their operational performance.
The largest producer, Newmont Goldcorp Corp (NYSE:) extracted 6.85 million ounces of gold in 2024. However, its cost of production is relatively high compared to peers, making it less efficient in converting higher gold prices into profit margins.
With 3.9 million ounces produced, Barrick Gold (NYSE:), the oldest among the group, has a storied history. Interestingly, its production in 2012 was nearly double the current level, indicating a decline over the years. Despite this, Barrick boasts one of the lowest costs of production, enhancing its profitability.
Producing 3.5 million ounces, Agnico Eagle (NYSE:) also benefits from a low cost of production, positioning it well to capitalize on rising gold prices.
AngloGold Ashanti produced 2.6 million ounces, with a cost of production slightly below the industry average, making it another efficient player.
Extracting 2.1 million ounces, Kinross’s production costs vary widely by deposit, but analysts estimate its average cost aligns with the industry norm.
Over the past five years, all five companies have increased production, a logical response to gold’s rising price, which enhances the attractiveness of the mining business. Lower production costs, as seen with Barrick Gold and Agnico Eagle, allow these companies to maximize profits as gold prices climb, while companies like Newmont face tighter margins due to higher costs.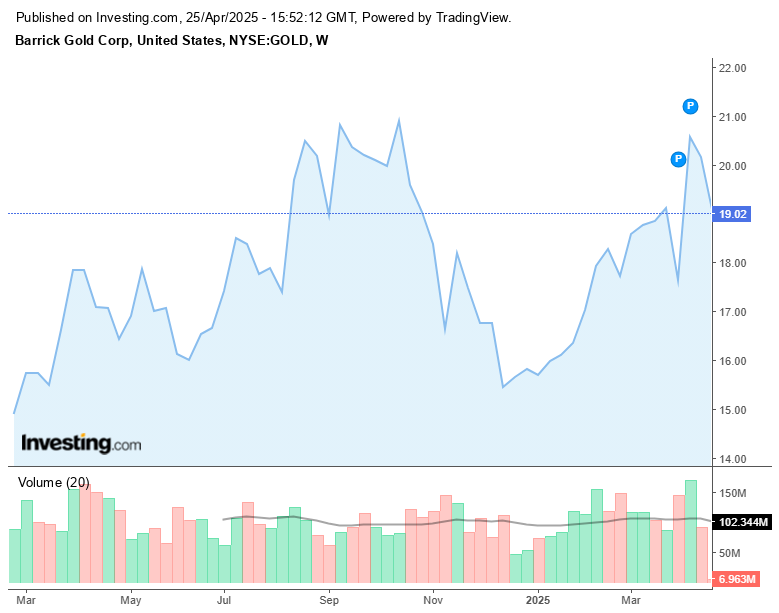
Financial Metrics: Identifying Investment Opportunities
To assess investment potential, let’s dive into the financial metrics of these companies, focusing on price-to-earnings (P/E) ratios and forward P/E ratios, which provide insight into valuation and expected returns:
Current P/E Ratios: Newmont’s P/E is 18.9, Barrick Gold’s is 16.7, Agnico Eagle’s is 32, AngloGold Ashanti’s is 18.9, and Kinross’s is 19.4.
The sector average P/E is around 19, indicating that Barrick Gold (16.7) and AngloGold Ashanti (18.9) are relatively undervalued compared to peers.
Forward P/E Ratios: Looking at forward P/E, which accounts for projected earnings, Newmont stands at 12.8, Barrick Gold at 9.92, Agnico Eagle at 20, AngloGold Ashanti at 9, and Kinross at 13.5.
Again, Barrick Gold and AngloGold Ashanti lead with the lowest forward P/E ratios (9.92 and 9, respectively), suggesting they offer the best value for future returns.
Additionally, the price-to-growth (P/G) ratio, a forward-looking metric similar to forward P/E, also favors Barrick Gold and AngloGold Ashanti, with both showing values below 1, indicating strong growth potential relative to their stock prices.
These metrics consistently highlight Barrick Gold and AngloGold Ashanti as the most attractive investment options among the top five, thanks to their low production costs, undervalued stocks, and promising growth prospects.
Technical Analysis: Barrick Gold’s Stock Performance
Barrick Gold, with its ticker GOLD, offers a compelling case for technical analysis due to its long trading history. Barrick’s stock reached a peak of $55 per share in 2012, a level that seems ambitious given current market conditions.
As of April 23, 2025, Barrick Gold’s stock price is $18.73. While reaching $55 may be unlikely in the near term, the stock’s correlation with gold prices suggests potential upside. Recent analyses indicate a bullish outlook, with some traders targeting $25 upon breaking resistance, potentially yielding a 33% gain from current levels.
Investment Options: Stocks or ETFs?
While buying physical gold or gold ETFs like SPDR Gold Shares (NYSE:) is a popular choice, people are increasingly getting inclined for gold mining stocks due to their leveraged exposure to gold price movements.
GLD has risen 42% over the past year, but the VanEck Vectors Gold Miners ETF (NYSE:), which tracks an index of gold mining companies, has outperformed with a 50% gain, reflecting the sector’s higher sensitivity to gold prices. Historically, the gold miners’ index has shown a volatility ratio of roughly 3:1 compared to gold-when gold rises 1%, the index might rise 3%, amplifying returns but also risks.
For those seeking even higher leverage, margin-based ETFs like NUGT (bullish on gold miners) and DUST (bearish) offer amplified exposure, with historical volatility ratios ranging from 9:1 to 12:1 relative to gold price changes.
However, these instruments are riskier and better suited for experienced traders. For most investors, individual stocks like Barrick Gold and AngloGold Ashanti, or a diversified ETF like GDX, provide a balanced way to capitalize on gold’s rally without the complexities of physical gold storage or the wide spreads associated with gold accounts.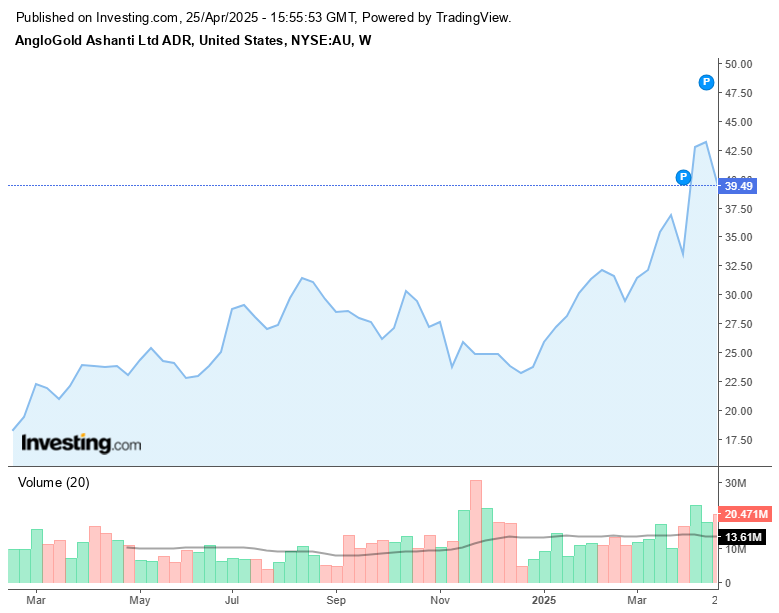
Risks and Market Outlook
Investing in gold mining stocks carries risks, particularly given gold’s volatility. While the current price of $3,331 per ounce reflects a strong uptrend, some analysts predict a potential drop to $1,820 per ounce if supply increases and demand from central banks wanes.
The Fed’s rate decision on May 7, 2025, will be pivotal-faster rate cuts could propel gold higher, but a slower pace might temper the rally. Additionally, the gold miners’ index exhibits higher volatility than gold itself, with spreads between the index and gold prices fluctuating, potentially reaching 1:20 in extreme conditions due to rising market liquidity.
So, What do We Have in The End?
Gold’s record-breaking rally to $3,434.4 per ounce in April, up from $2,600 at the year’s start, underscores its appeal amid global uncertainty. Among the top gold mining companies, Barrick Gold and AngloGold Ashanti stand out as prime investment opportunities, offering low production costs, undervalued stocks (P/E of 16.7 and 18.9, forward P/E of 9.92 and 9), and strong growth potential. Investors can also consider the GDX ETF for diversified exposure, which has outperformed gold with a 50% gain over the past year.
As the Fed’s rate decision looms, gold mining stocks present a compelling way to leverage gold’s upward trajectory, provided investors remain mindful of the sector’s volatility and broader market risks.