
The market enters Week 35 with a downward price trend. The NGU25 contract expired 7% lower and NGV25 trades 5-7% below the 15-year average, while NGX25 hovers near the median. A robust 34 BCF storage gain for Week 34 (August 18-24) keeps fill rates above the five-year median, easing shortage risks with the pumping season underway.
Cooler weather, with Week 35 HDD+CDD well below 30-year averages, further dampens prices by reducing air conditioning demand. Despite the fact that the supply-demand differential remains above the 10-year range due to strong production and recovering exports, market dynamics indicate ongoing pressure.
Current prices vs. price spread 10 days before expiration by month since 2010

Over the past week, the gas price has been downtrending. The NGU25 contract expired 7% lower and the next contract NGV25 is trading 5-7% below the average price 10 days before expiration for all expired contracts over the previous 15 years. NGX25 is trading near the median. The 2026 and 2027 contract prices are virtually unchanged from last week and are trading at or below the upper quantile boundary for almost all months.
Current forward curve vs. 2020-2024

The shape of the forward curve is flattening out, and resembling closer and closer the curve on the same calendar day of 2023, 2024 annual curves. This is especially noticeable on contracts with delivery 3 years from now and beyond. The divergence on near-term contracts is still large.
Current inventory and forecast for next week compared to 2019-2024

For week 34 (Aug 18-24), a +34BCF gain in storage was recorded. Fill rate is holding steady above the median for the previous 5 years. Injection rates remain positive, which removes the risk of shortages due to the imminent start of the pumping season and contributes to downward price pressure.
Weekly HDD+CDD total from current NOAA data and forecast for the next two weeks comparing 1994-2024

In the overall continental cross-section, the past week 35 weather was well below average values observed over the past 30 years. Next week (36) HDD+CDD values are also expected to be well below average, contributing to lower electricity demand for air conditioning to downward price pressure.
Explanation of the chart: candles represent quantiles for 30 years from 1994 to 2024. Red dots 2024, green 2025, blue prediction 2025
Weekly HDD+CDD total from current NOAA data and forecast for the next two weeks compared to 1994-2024 by region
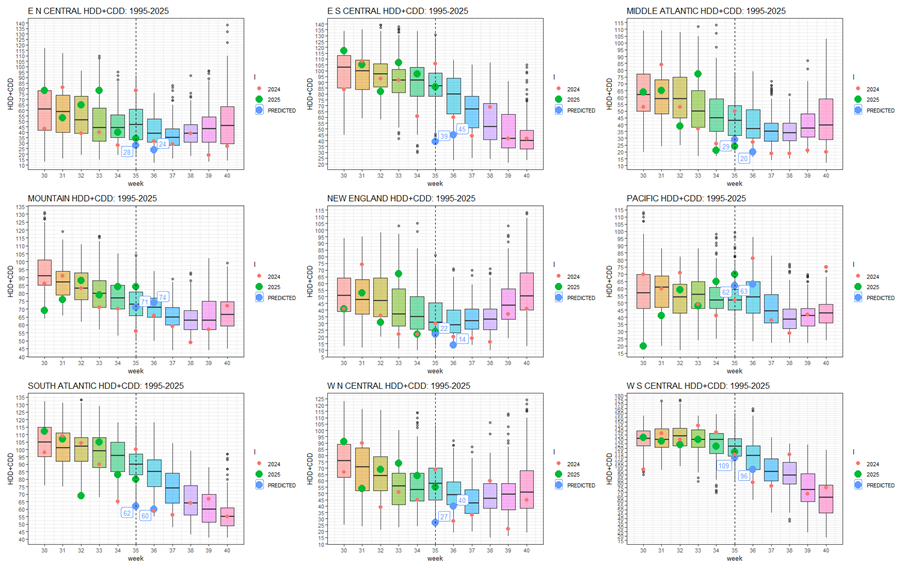
The projections by major regions are consistent with the overall picture: HDD+CDD values are below the average level based on observations over the past 30 years.
Weekly cumulative supply/demand differentials compared to 2014-2024

For the third week in a row, the supply/demand differential held above the upper 10-year range. Production is holding strong, imports from Canada are down, exports to Mexico and LNG exports have recovered, while electricity demand is seasonally down slightly. The latter is additionally impacted by weather and industrial demand patterns and is holding at average levels.
This LNG analysis was prepared by Dr. Igor Isaev in cooperation with Anastasia Volkova, LSE analyst.